Question about Visualization Grids Used for Charts
I've seen a lot of posts in the forum of people showing things like artists with the most no 1s using a grid visualization, and other things like a whole calculated hot 100 sheet. Sorry if I sound inexperienced since I'm new to this, but what websites or features do you guys use to make these visualizations?
Normally, when you click on a chart statistic, next to the settings button there is a share option (as in the print below):

There you can view various grid layouts. It's up to you to choose which one you prefer :> but some grids may have additional details (for example, a higher limit on the number of items in the grids, the ability to add subtitles, etc., as shown in the screenshot below). Just click on download (that bluish button)
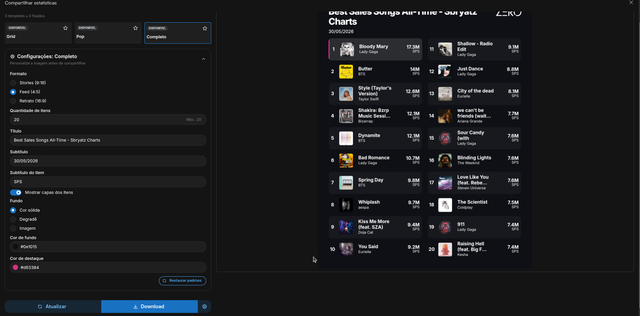
You'll need to get the photo and then go to a website authorized here to convert the photo into a html link, copy it and paste it here, since the site currently can't post photos yet.
I use Imgbb.com, but I think there might be other sites that do this too (as long as it's approved by the adm, unless I'm mistaken).
Truly, thank you so much! I really appreciate your help!